OV Defect Creator Studio · VisA PCB1 benchmark
Can you train a defect detection model with synthetic data?
We benchmarked it. Ten real defect photos plus 50 images generated in OV Defect Creator Studio matched the 50-real-photo benchmark at 84% on one seed. On another, the model outperformed it, catching 86% of defects.
A fifth of the real defect data.
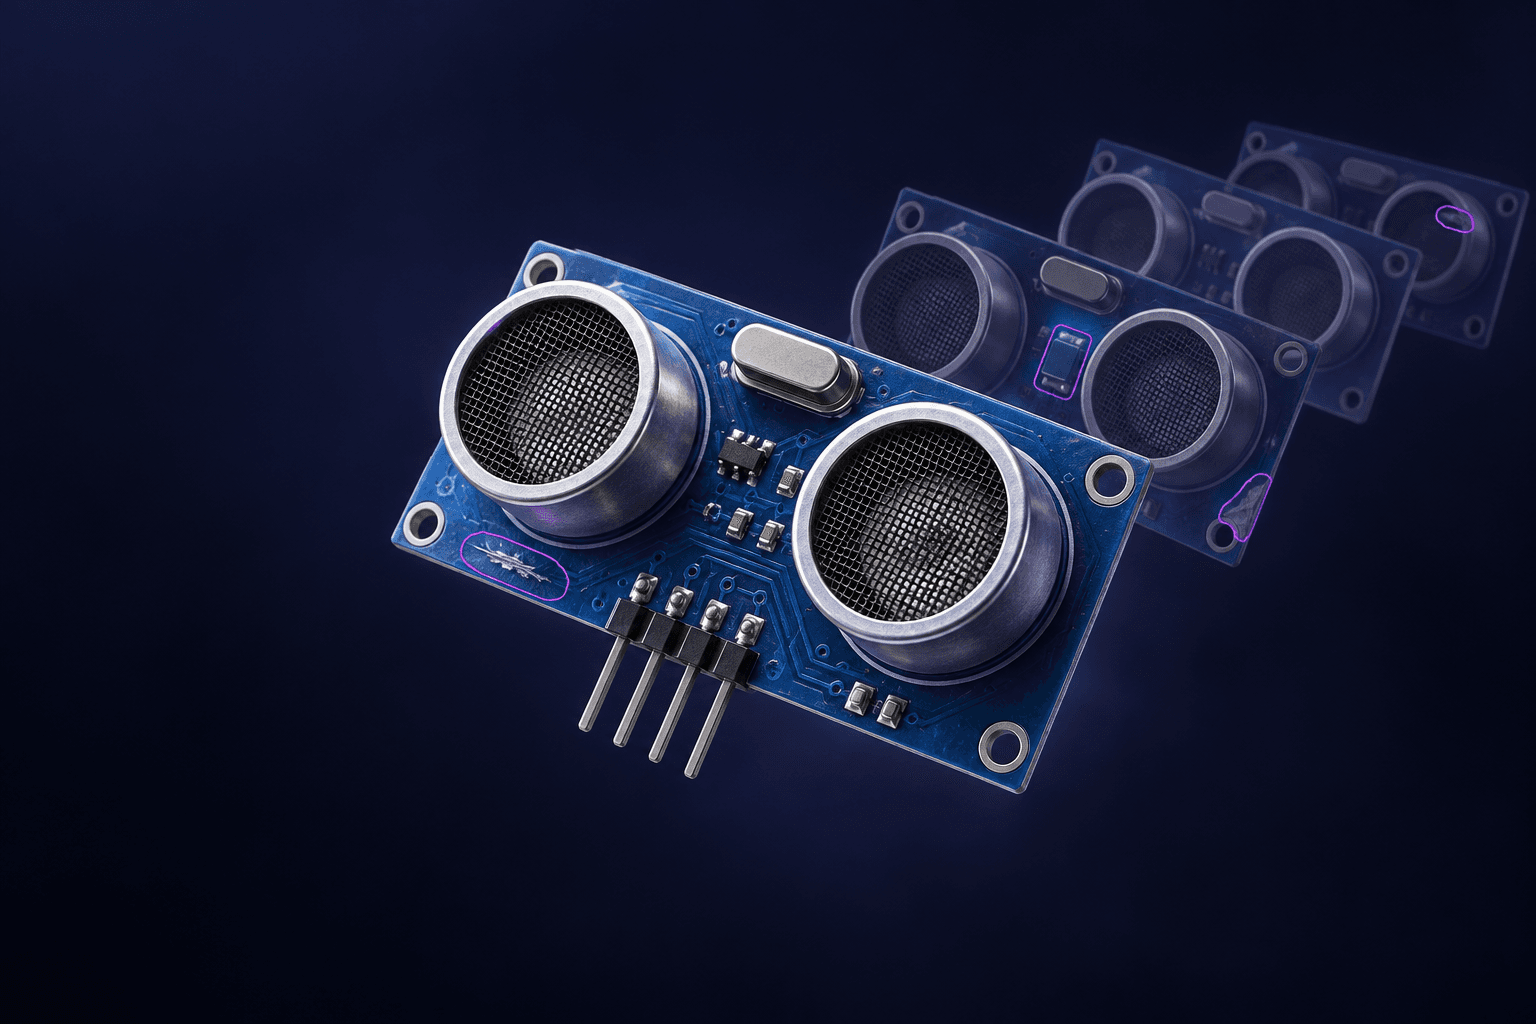
The bottleneck: collecting real defect images
A visual inspection project can have a camera, lighting, and a clear definition of a bad part, yet still wait on training data. Good parts are easy to photograph. A particular scratch, bent pin, or missing component may take weeks or months to appear often enough to build a useful defect library.
Teams either wait for scrap or damage parts on purpose. Synthetic defect generation offers another way to collect training examples. The question we wanted to answer was concrete: can those generated images help a model catch defects in real photographs?
What we benchmarked
We used PCB1 from the public VisA dataset, comparing real defect photos with images generated in OV Defect Creator Studio. The training pool contained 50 real defect images and 50 generated images, covering scratches, bent pins, missing components, and melt defects.
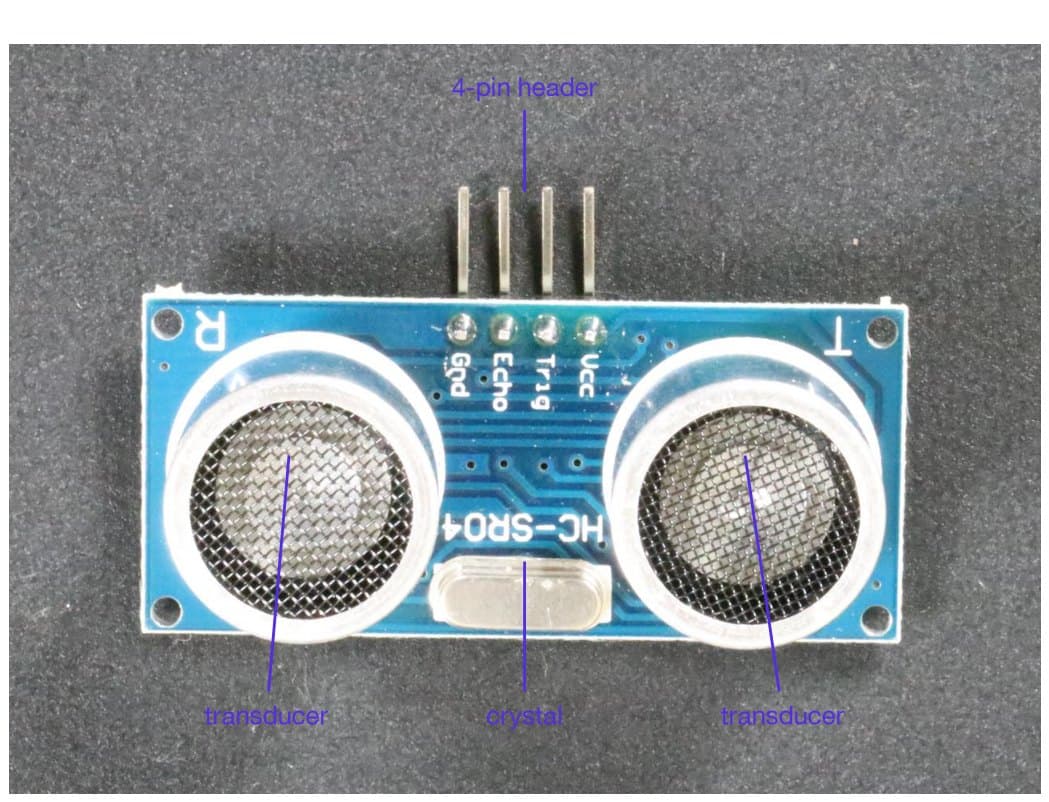
The actual benchmark part
One board, four defect categories
PCB1 depicts an HC-SR04 ultrasonic sensor board. Its exposed pins, blue coating, transducers, and crystal provide different surfaces and structures for the detector to learn.
VisA image by Zou et al., CC BY 4.0. Cropped and annotated by Overview AI.
Same model. Same real test images.
- A stock open-source U-Net segmentation model, held fixed across comparisons.
- Different mixes of real and generated defect images, tested across multiple seeds.
- The same held-out real images for every comparison.
- Defect catch rate measured at a 2% false-reject limit.
A false reject is a good part incorrectly flagged as defective. Holding that limit fixed makes the comparison useful: a model cannot earn a better result simply by rejecting more good parts. The experiment measures the value of the training data using a common model.
A closer look at the training setup
The U-Net used a ResNet-34 encoder, 512 × 512 inputs, and a fixed optimization-step budget. Each training mix paired its defect images with an equal number of defect-free images. Keeping these settings consistent helped isolate the effect of changing the defect data.
Real subsets were sampled again for each seed. With a small collection, which examples enter training can make a substantial difference. Multiple seeds let us examine more than one draw and training run.
We also standardized board orientation before training and evaluation. PCB1 contains boards photographed in two opposing orientations, and orientation correlates with the good or defective label. Aligning the images and masks removes that shortcut so the comparison focuses more directly on defects.
The result: matching and exceeding the real-data benchmark
Training with 50 real defect photos produced an average catch rate of 84%. With only 10 real defect photos, the average was 58%. That gap is the problem a team faces when its real defect collection is still small.
Adding 50 generated images to those 10 real defect photos changed the result. Across multiple seeds, one run matched the 84% benchmark. Another reached 86%, exceeding it with 40 fewer real defect photos.
Matched the benchmark
84%
10 real + 50 generated · one seed
Exceeded the benchmark
86%
10 real + 50 generated · another seed
These individual runs show that generated examples can help a detector reach the real-data benchmark with a much smaller collection of real defects. For manufacturers, that means a useful route to expanding training coverage while rare examples are still difficult to obtain.
Scratch detection more than doubled
The clearest improvement was in scratches. With 10 real defect images, the model caught 33% of scratch defects. Adding 50 generated images raised that to 75%, without collecting a single additional real defect photo.
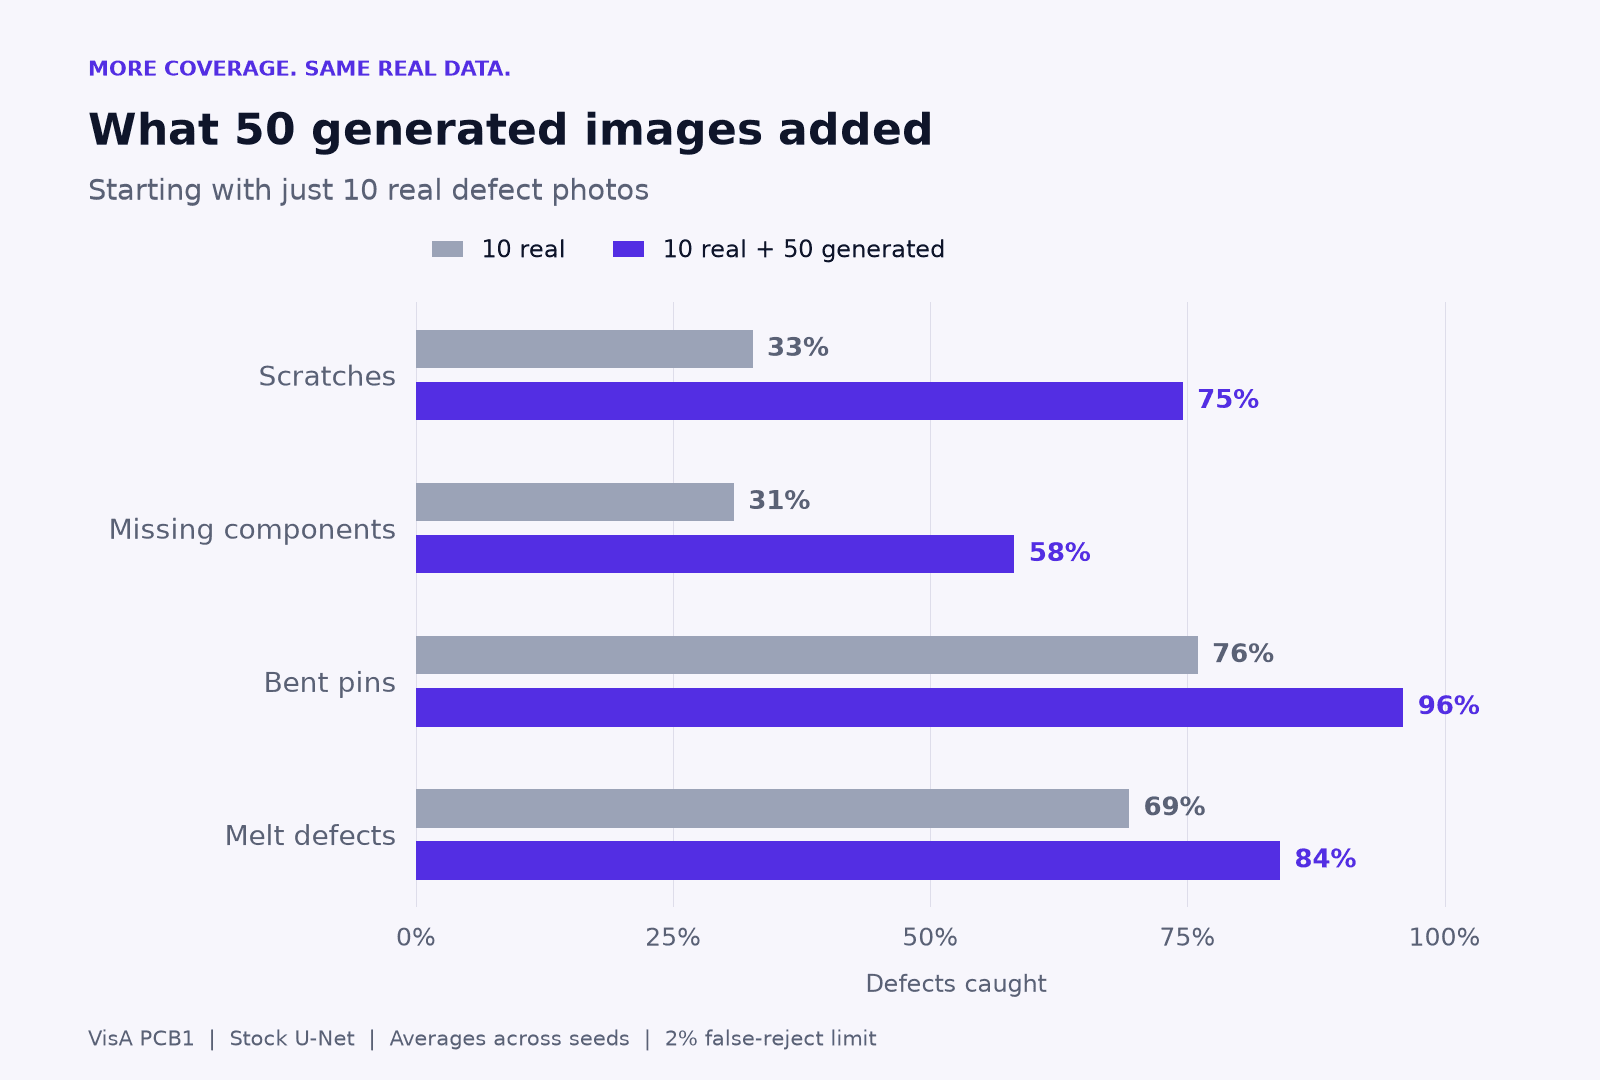
Missing-component detection also rose from 31% to 58%. Bent-pin detection improved from 76% to 96%, and melt detection from 69% to 84%. All four defect categories improved in this 10-real-image comparison.
This is where synthetic data becomes especially useful: it gives the model more examples of defects that a small real dataset does not represent well. Instead of waiting for another damaged board, an engineer can generate targeted variations and measure whether they help.
Look at the real and generated defects
The examples below come from the study itself. Choose a defect type to compare real VisA photographs with generated training examples. The outlines are annotations identifying the defect regions, not predictions from the detector.
Scratches: real vs. generated
33% → 75% caughtSwipe across the examples, or open the full-size image below.
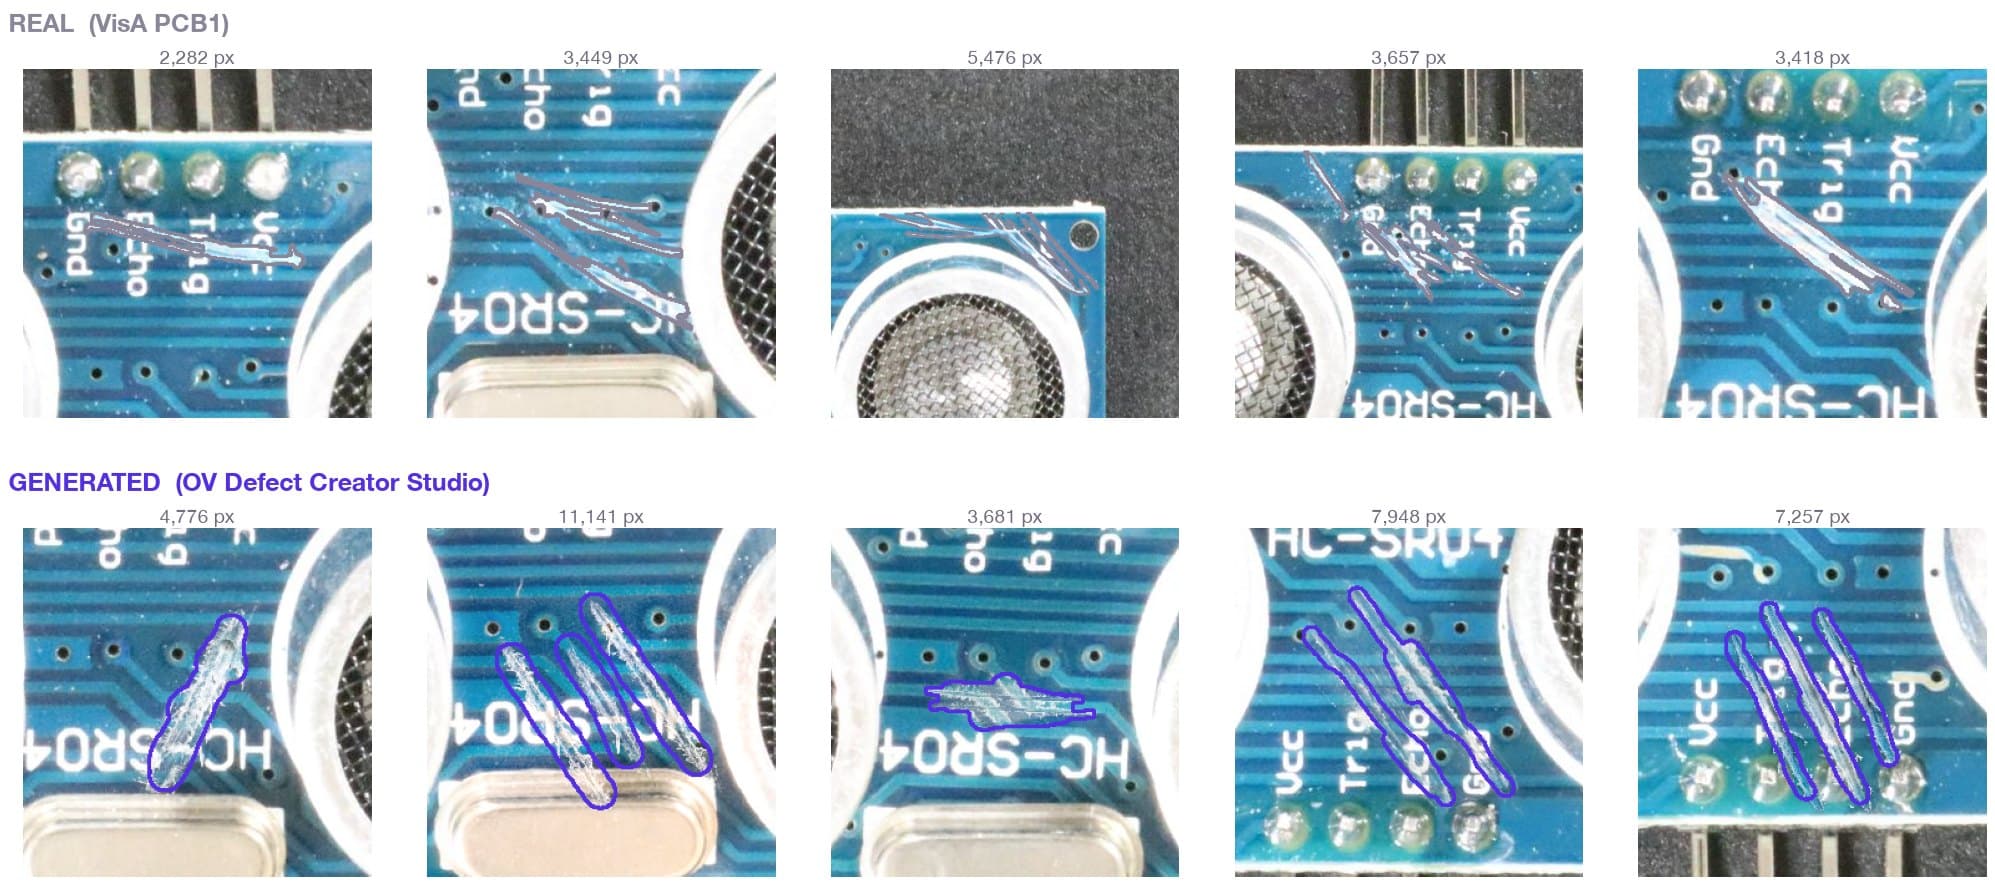
Look for pale abrasions where the blue coating has been scraped away. The examples vary in length, direction, and the number of parallel marks. Teaching this range is more useful than repeating one obvious gouge.
Open full-size scratches examples ↗Catch rates are rounded averages across seeds for 10 real defect images before and after adding 50 generated images, at a 2% false-reject limit. Images derived from VisA, Zou et al., under CC BY 4.0. Cropping, annotations, and synthetic modifications by Overview AI.
How we built the generated training set
Each generated image began with a defect-free board from the training side of the split. The operator used OV Defect Creator Studio to place a defect on that board, then painted a segmentation mask around the defective material. The generated set covered the same four categories as the real training pool, including a few boards with more than one defect.
The visual details mattered. On this PCB, a scratch is typically a pale abrasion through the coating. A bent pin involves displacement of the leg. Missing components expose surfaces or pads that were previously covered. Those are specific appearances a training set needs to represent, beyond the broad labels “scratch” or “bent.”
The melt examples show why category coverage alone is not enough. Real examples include deposits around pins and pads as well as on the metal crystal can, while the generated examples shown above are concentrated around the pins and pads. Inspecting that difference gives the engineer a concrete direction for the next round of generation: add the missing appearance, not just more copies of the same one.
What the numbers mean for visual inspection
The result supports a practical workflow: start with the real defect images you have, use generated examples to fill gaps, and validate on real images. A model missing scratches needs a better scratch library. A model missing a particular bent-pin shape needs examples of that shape.
This benchmark used a stock U-Net on one PCB dataset. Its percentages describe that experiment, rather than the performance of an Overview AI camera or a complete production inspection system. Keeping the model fixed lets us examine what the generated training data contributes.
The opportunity is to shorten the wait for useful training examples. Teams can build coverage for known rare failure modes earlier, then keep refining the inspection as more real production images become available.
Frequently asked questions
Can synthetic data train a model to detect real defects?
Yes. In our VisA PCB1 benchmark, a stock U-Net trained with 10 real defect images and 50 generated images matched the 84% real-data benchmark on one seed and reached 86% on another. Evaluation used real images at a 2% false-reject limit.
Which defects benefited from generated training images?
When we added 50 generated images to 10 real defect images, average scratch detection increased from 33% to 75%, missing-component detection from 31% to 58%, bent-pin detection from 76% to 96%, and melt detection from 69% to 84%. These rounded results use the same 2% false-reject limit.
Does this benchmark measure an Overview AI camera?
This benchmark measures the contribution of OV Defect Creator Studio training data using a stock open-source U-Net segmentation model. It does not measure an Overview AI camera or its production inspection software.
Why wait months for rare defects?
Generate examples on your own product images with OV Defect Creator Studio and start building the defect coverage your inspection needs.
Related Articles
How OV Auto-Defect Creator Studio works
Create synthetic defect images for your visual inspection training workflow.
Read More →Validate your inspection before production
Build a real test set and use the missed defects to improve your inspection.
Read More →Synthetic defect data for changing product mixes
Explore how generated examples can help with high-volume, medium-mix manufacturing.
Read More →