
 OV Atlas
See what changed across lines, shifts, and sites
Ask about yield, defects, or line performance in plain language. Turn the answers into dashboards and recurring reports your quality team can use.
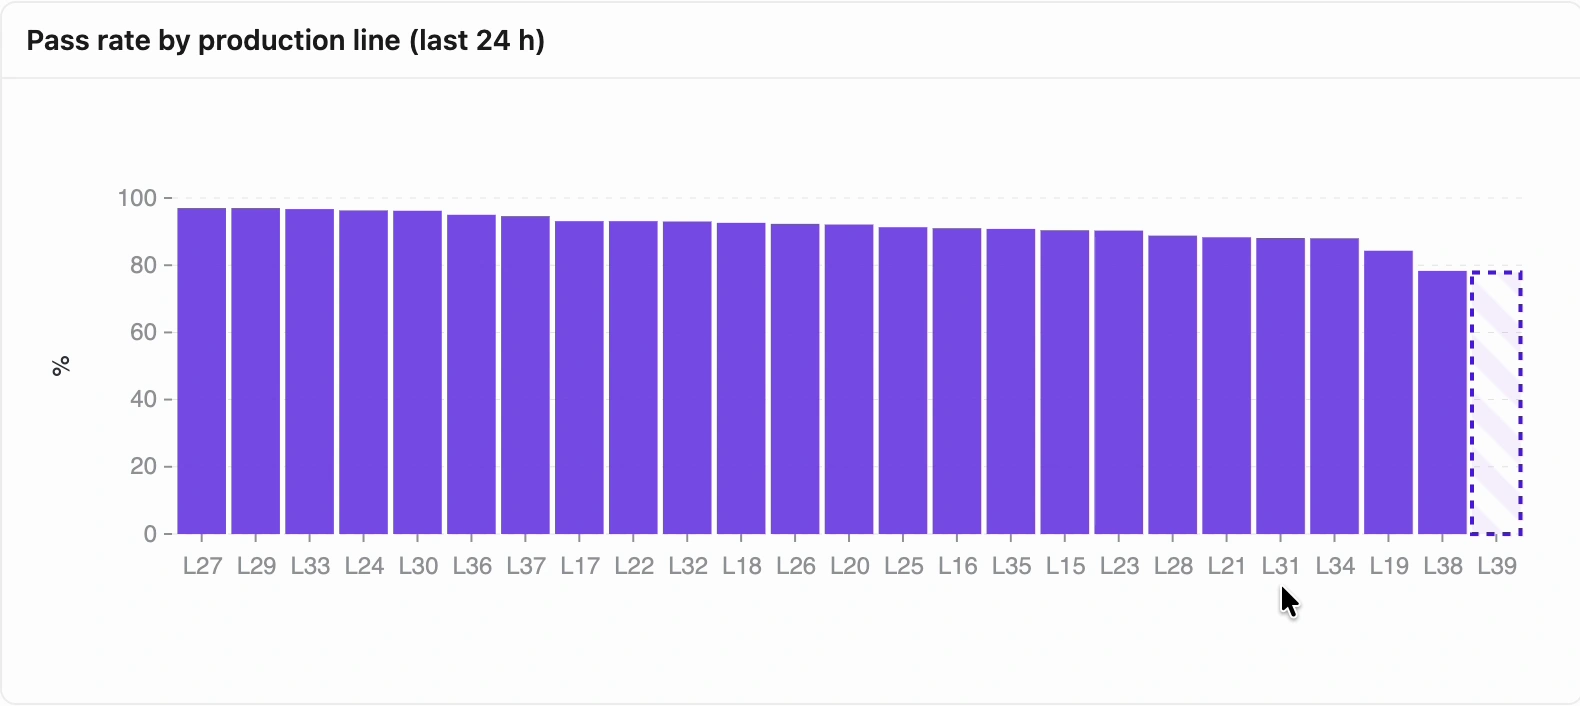
What you can do with OV Atlas
Natural language questions
Ask an AI agent about connected line and camera data without building a report from scratch.
Cross-line and site comparisons
Compare available inspection results across lines, shifts, or connected facilities.
Custom dashboards
Save charts and data cards for the questions your quality team checks regularly.
Scheduled reports
Schedule report generation so recurring quality reviews start with the data the team needs.
Verify findings against inspection records
Use the charts and underlying records to check AI-generated findings before acting on them.
How teams use OV Atlas
Start with a question about which line changed or which defect is driving rejects. Review the underlying results, then save a dashboard or schedule a report to keep watching the trend.
See all OV Pro ToolsDiscuss OV Atlas with our team
Tell us about your cameras, inspection workflows, and sites.